Finance Director's Report

"Group revenue in FY12, at £863.1m, comprised Retail revenue of £752.3m and Autocentres revenue of £110.8m."
Andrew Findlay
Finance Director
Halfords Group plc ("the Group" or "Group")
Reportable Segments
Halfords Group operates through two reportable business segments:
- Halfords Retail, operating in both the UK and Republic of Ireland; and
- Halfords Autocentres, operating solely in the UK.
All references to Group represent the consolidation of the Halfords ("Halfords Retail"/"Retail") and Halfords Autocentres ("Halfords Autocentres"/"Autocentres") trading entities.
Financial Results
| FY12
£m | FY11
£m | %
Change |
| Group Revenue |
863.1 |
869.7 |
-0.8% |
| Group Gross Profit |
472.8 |
485.0 |
-2.5% |
| Group Operating Profit |
97.2 |
128.1 |
-24.1% |
| Net Finance Costs |
(5.0) |
(2.5) |
— |
| Profit Before Tax, before non-recurring items |
92.2 |
125.6 |
-26.6% |
| Profit Before Tax, after non-recurring items |
94.1 |
118.1 |
-20.3% |
All above items are shown before non-recurring items unless otherwise stated.
The "FY12" accounting period represented trading for the 52 weeks to 30 March 2012. The comparative period "FY11" represented trading for the 52 weeks to 1 April 2011.
UK/ROI Retail Revenue £752.3m
-2.3%
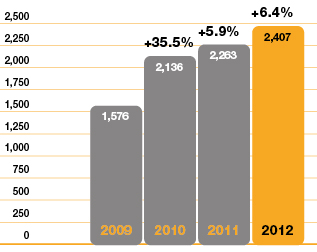
wefit/werepair jobs
'000s
+6.4%
Group revenue in FY12, at £863.1m, comprised Retail revenue of £752.3m and Autocentres revenue of £110.8m. This compared to FY11 Group revenue of £869.7m, comprising Retail revenue of £771.6m and Autocentres revenue of £98.1m. Group revenues decreased by 0.8%, but when excluding the discontinued Central European revenues in the comparable period, the decrease was restricted to 0.5%.
Group gross profit at £472.8m (FY11: £485.0m) represented 54.8% of Group revenue (FY11: 55.8%). This reflected a decline in UK/ROI Retail business of 140 basis points ("bps") and a gross margin of 65.9% (FY11: 66.3%) in the Autocentres business.
Total operating costs before non-recurring items increased to £375.6m (FY11: £356.9m), of which Retail represented £307.0m (FY11: £296.7m), Autocentres £66.4m (FY11: £58.0m) and unallocated expenses £2.2m (FY11: £2.2m). Unallocated expenses represented amortisation charges in respect of intangible assets acquired through business combinations (the acquisition of Nationwide Autocentres Ltd in February 2010), which arise on consolidation of the Group. Non-recurring income during the year of £1.9m represented the release of the Focus lease guarantee provision, recognised as a non-recurring cost in FY11, resulting from the better-than-anticipated settlements in the period.
Net finance costs for the period were £5.0m (FY11: £2.5m).
Group profit before tax and non-recurring items for the 52 weeks to 30 March 2012 was down 26.6% at £92.2m (FY11: £125.6m).
Group profit before tax for the 52 weeks to 30 March 2012 after non-recurring items was £94.1m (FY11: £118.1m), down 20.3%.
Halfords Retail (before non-recurring items)
| FY12
£m | FY11
£m |
|
| UK/
ROI | Central
Europe | Total | UK/
ROI | Central
Europe | Total | UK/ROI % Change |
| Revenue |
752.3 |
— |
752.3 |
769.7 |
1.9 |
771.6 |
-2.3% |
| Gross Profit |
399.8 |
— |
399.8 |
419.9 |
0.1 |
420.0 |
-4.8% |
| Operating Costs |
(307.0) |
— |
(307.0) |
(296.2) |
(0.5) |
(296.7) |
+3.6% |
| Operating Profit |
92.8 |
— |
92.8 |
123.7 |
(0.4) |
123.3 |
-25.0% |
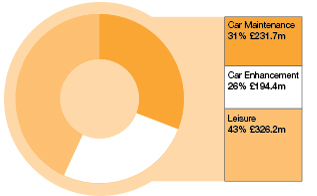
Revenues for the UK/ROI business of £752.3m reflected, on a constant currency basis, a like-for-like ("LfL") sales decline of 2.7%. This was partially offset by £3.7m of revenue from new space, reducing the sales deficit to 2.3%. By category, Car Maintenance and Car Enhancement LfL revenues were down 4.5% and 11.6% respectively, Leisure LfL revenues were up 5.0%. The relative split of UK/ROI revenues is shown below.
Proportion of UK/ROI Retail Sales
| FY12 | FY11 |
| Car Maintenance |
30.8% |
31.4% |
| Car Enhancement |
25.9% |
28.4% |
| Leisure |
43.3% |
40.2% |
Gross profit for the UK/ROI business at £399.8m (FY11: £419.9m) represented 53.1% of sales, a 140 bps decline on the prior year (FY11: 54.5%). This reflected the continued focus on the delivery of cash returns within the business, increased levels of promotional participation by our customers, reduced sales of higher-margin ranges and the impact from our focus on efficient stock clearance. The effect of these, together with the adverse results of product cost inflation, was partially offset by the continuing increased penetration of our unique, high-margin wefit and werepair propositions and continued focus on maximising product-sourcing efficiencies.
Operating costs for Retail before non-recurring items were £307.0m (FY11: £296.7m), up 3.6%. In FY11, UK/ROI operating costs before one-off store occupancy and support cost savings were c.£300m. Based on this, the underlying increase in UK/ROI Retail operating costs in the period was restricted to 2.3%. The increase reflected higher store and support costs, offset by savings in warehouse and distribution costs.
UK/ROI Retail
Operating Costs
| FY12
£m | FY11
£m | %
Change |
| Store Staffing |
80.1 |
78.1 |
+2.6% |
| Store Occupancy |
139.0 |
135.4 |
+2.7% |
| Warehouse & Distribution |
25.9 |
27.5 |
-5.8% |
| Support Costs |
62.0 |
55.2 |
+12.3% |
| Total |
307.0 |
296.2 |
+3.6% |
Store staffing costs rose 2.6% which represented the continued benefits of the restructuring of store labour rotas in the prior year and lower-than-forecast store colleague incentive payments, offset by inflationary and minimum wage pay increases year-on-year. Store occupancy costs increased by 2.7%, reflecting c.£3m of one-off benefits in FY11, inflationary increases in rent, rates and utility costs, and included the revenue costs associated with 83 store refreshes in the period.
Warehouse and distribution costs fell by 5.8%, driven by the expected improvements in efficiency being delivered following the move to the new Distribution Centre in Coventry in July 2010. Under the old distribution network, costs would have been approximately £3.8m higher than those reported.
The increase in support costs predominantly reflected our investment in colleagues ahead of FY13 through ensuring we have the right resources to drive sustainable growth in the key areas. As an example of this, we recently appointed our first Digital Director to maximise the multi-channel opportunity ahead of us. We also invested in store colleague training and engagement to ensure we are equipped to drive additional in-store service revenues at our Company-wide managers' conference. We also invested during the year to obtain a better understanding of our markets, customers and future growth opportunities. No Head Office performance bonus for the period was accrued.
In FY11, the Central European Retail operation generated revenue of £1.9m and a loss before taxation of £0.4m, after operating costs of £0.5m. The operations were fully wound down in FY11, and no revenues or costs associated with this operation were recognised during the period.
Halfords Autocentres
| FY12
£m | FY11
£m | %
Change |
| Revenue |
110.8 |
98.1 |
+12.9% |
| Gross profit |
73.0 |
65.0 |
+12.3% |
| Underlying Operating Costs |
(66.0) |
(58.0) |
+13.8% |
| Underlying Operating Profit |
7.0 |
7.0 |
— |
| One-off Relocation Costs |
(0.4) |
— |
— |
| Statutory Operating Profit |
6.6 |
7.0 |
-5.7% |
Autocentres generated total revenues of £110.8m in FY12 (FY11: £98.1m), an increase of 12.9% over the prior year, a like-for-like increase of 6.1%. Twenty new autocentres opened in the year, generating £2.2m of incremental revenue, which took the total number of autocentre locations to 260 as at 30 March 2012. The increase in revenues from the existing 240 centres reflected the benefit of the UK-wide brand relaunch completed in April 2011, enhanced media support and growth in tyre sales, an area of opportunity for Autocentres.
Gross profit at £73.0m represented a gross margin of 65.9%, down 40 basis points on comparable FY11 levels, driven by increased volumes of lower-margin tyre sales, partially offset by better parts-buying.
Before a one-off charge of £0.4m associated with the transfer of the Autocentres Head Office from Olton to Redditch (completed in April 2012), Autocentres' operating profit was £7.0m (FY11: £7.0m) reflecting underlying operating costs of £66.0m (FY11: £58.0m). To secure long-term growth and profitability, investment in the business continued. A successful media campaign, investment in tyre training, rebrand depreciation and the impact of new centre opening activity contributed to the operating cost increase.
Portfolio Management
The Group continued to manage actively its store and autocentre portfolio. During FY12, the Retail business opened three stores in London (Wood Green, Ilford, Ealing), closed two metro stores (Norwich, Haywards Heath) and refurbished 83 stores. Within Autocentres, 20 new centres were opened in the period.
With the exception of nine long-leasehold and two freehold properties within Autocentres, the Group's operating sites are occupied under operating leases, the majority of which are on standard lease terms, typically with a five to 15 to 25-year term from inception and with an average lease length of around seven years.
During the year re-gear negotiations were completed on 14 stores, resulting in six contracts being exchanged on lease extensions, five downsizes and three relocations resulting in lower ongoing rental payments.
Focus Leases
At the end of FY11, a non-recurring charge of £7.5m was recognised in respect of a provision for property leases for which Halfords was guarantor, triggered by the demise of the Focus DIY retail chain. At the end of FY12, the provision was £3.1m reflecting the settlement and exit of certain leases, resulting in non-recurring income of £1.9m during the year, and utilisation of the provision in respect of rent, insurance, service charges and legal fees incurred.
Finance Costs
Net finance costs were £5.0m (FY11: £2.5m). The higher charge in the period reflects a full year of loan facility non-utilisation fees, margins and arrangement-fee amortisation expense. A one-off benefit of £0.9m interest income was also recognised in the prior period relating to the settlement of amounts due from HMRC. Weighted average borrowings of £116.7m were £37.6m lower than last year.
Taxation
The taxation charge on profit for the financial year was £25.7m (FY11: £32.6m), including a £0.9m charge (FY11: £2.1m credit) in respect of the tax on non-recurring items. After non-recurring items, the full year effective tax rate of 27.3% (FY11: 27.6%) differed from the UK corporation tax rate (26.0%) principally due to the non-deductibility of depreciation charged on capital expenditure, the reassessment of anticipated future tax deductions from employee share schemes and other permanent differences arising in the period. Before non-recurring items, the full year effective tax rate in FY12 was 26.9%.
Earnings Per Share ("EPS")
Basic EPS before non-recurring items was 33.7 pence (FY11: 43.2 pence), a 22.0% decrease on the prior year. Basic EPS after non-recurring items for the period was 34.2 pence (FY11: 40.7 pence). Basic weighted average shares in issue during the year were 199.9m (FY11: 210.4m). During the year 18,084,113 shares were acquired by the Company via the share buyback programme commenced in April 2011. Of these, 12,634,493 have been cancelled, with 5,449,620 converted to treasury shares to be used by the Group to satisfy existing and future employee share schemes.
Dividend
The Board is recommending a final dividend of 14.0 pence per share (FY11: 14.0 pence), which, in addition to the interim dividend of 8.0 pence per share (FY11: 8.0 pence), generates a total dividend of 22.0 pence (FY11: 22.0 pence). This reflects the Board's recognition of the importance of dividends to shareholders and the continuing cash-generative capabilities of the business.
Subject to shareholder approval at the Annual General Meeting the final dividend will be paid on 3 August 2012 to shareholders on the register at the close of business on 6 July 2012.
Capital Expenditure
Capital investment in the period totalled £19.7m (FY11: £22.8m) comprising £15.2m in Retail and £4.5m in Autocentres. Consistent with prior periods, management has continued to adopt a prudent approach with regard to capital investment and has focused on investments generating material returns.
Within Retail, £11.5m was invested in stores, and included £1.2m in three new London stores, together with two completed store relocations. It also included £10.3m of investment in 83 store refreshes, the rightsizing of two stores, other expenditure covering general maintenance and the investment in three laboratory store formats opened recently. Additional investment in Retail infrastructure included a £2.4m investment in IT systems, including further development of the online customer proposition, £1.0m in logistics and £0.3m in central facilities.
A further £4.5m (FY11: £6.2m) was invested in Autocentres predominantly to drive the centre roll-out plan and upgrade centre equipment, especially in relation to the delivery of the tyre proposition.
Inventories
Group stock held at 30 March 2012 was £146.7m (1 April 2011: £147.6m), down 0.6% on the prior year. Within this, Autocentres' stock was £1.4m, flat year-on-year. The management of inventory remains a key area of focus for the Retail business while the Autocentres business model is such that only small levels of inventory are held within the autocentres, with most parts being acquired on an as-needed basis.
Cash Flow and Borrowings
The Group has continued its strong track record of cash generation. Net cash generated from operating activities in FY12 was £89.7m (FY11: £118.4m). Free cash flow of £70.4m is after taking into account taxation, capital expenditure and net finance costs.
Total net bank debt at 30 March 2012 was £127.7m (1 April 2011: £91.4m) after cash balances of £10.9m. Further borrowings of £11.5m (FY11: £11.8m), in respect of the Head Office finance lease, resulted in Group net debt at 30 March 2012 of £139.2m (1 April 2011: £103.2m), an increase of £36.0m. At this level net debt to EBITDA (earnings before non-recurring items, finance expense, depreciation and amortisation) was 1.1 times.
Following a review by the Board of the Group's capital structure and cash-generation capabilities, the Group commenced a share buyback programme, with effect from 7 April 2011, with the intention to return up to £75m of cash to shareholders over the following 12 months. In FY12, £62.3m of shares were bought back via the purchase of 18.1m shares. As at 29 May 2012, a further £0.9m of shares were purchased in the new financial year.
Given the return to more normalised levels of gearing the Board has resolved to bring the current buyback programme to an end and does not intend to undertake any further buyback activity in the new financial year.
Financial Risks
Treasury Policy
The Group's treasury department's main responsibilities are to:
- Ensure adequate funding and liquidity for the Group;
- Manage the interest risk of the Group's debt;
- Invest surplus cash;
- Manage the clearing bank operations of the Group; and
- Manage the foreign exchange risk on its non-sterling cash flows.
Treasury activities are delegated by the Board to the Finance Director. The Finance Director controls policy and performance through the line management structure to the Group Treasurer and by reference to the Treasury Committee. The Treasury Committee meets regularly to monitor the performance of the treasury function.
Policies for managing financial risks are governed by Board approved policies and procedures, which are reviewed on an annual basis.
The Group's debt management policy is to provide an appropriate level of funding to finance the Business Plan over the medium term at a competitive cost and ensure flexibility to meet the changing needs of the Group.
The key risks that the Group faces from a treasury perspective are as follows:
Market Risk
The Group's exposure to market risk predominantly relates to interest, currency and commodity risk. These are discussed further below. Commodity risk is due to the Group's products being manufactured from metals and other raw materials, subject to price fluctuation. The Group mitigates this risk by negotiating fixed purchase costs or by maintaining flexibility over the specification of finished products produced by its supply chain to meet fluctuations.
Interest Rate Risk
The Group's policy aims to manage the interest cost of the Group within the constraints of the Business Plan and its financial covenants. The Group's borrowings are currently subject to floating rate interest rates and the Group will continue to monitor movements in the swap market.
Capital Risk Management
The Group's objectives when managing capital are to safeguard the Group's ability to continue as a going concern in order to provide returns for shareholders and other stakeholders and to maintain an optimal capital structure to reduce the cost of capital.
In order to maintain or adjust the capital structure, the Group may adjust the amount of dividends paid to shareholders, return capital to shareholders, issue new shares or sell assets to reduce debt. Between June 2006 and September 2009, the Group managed its capital structure partly through a share buyback scheme. A separate buyback scheme was initiated on 7 April 2011.
The Group manages capital by operating within debt ratios. These ratios are:
- consolidated EBITDAR (earnings before non-recurring items, finance expense, depreciation, amortisation and rental costs) to consolidated total net interest payable plus rent; and
- consolidated total net borrowings to consolidated EBITDA.
Credit Risk
The carrying amount of financial assets represents the maximum credit exposure. The maximum exposure to credit risk as at 30 March 2012 was £28.6m (1 April 2011: £15.5m).
Foreign Currency Risk
The Group has a significant transaction exposure with increasing, direct sourced purchases from its suppliers in the Far East, with most of the trade being in US dollars. The Group's policy is to manage the foreign exchange transaction exposures of the business to ensure the actual costs do not exceed the budget costs by more than 10% (excluding increases in the base cost of the product).
The Group does not hedge either economic exposure or the translation exposure arising from the profits, assets and liabilities of non-sterling businesses whilst they remain immaterial.
During the 52 weeks to 30 March 2012, the foreign exchange management policy was to hedge via forward contract purchase between 75% and 80% of the material foreign exchange transaction exposures on a rolling 12-month basis. Hedging is performed through the use of foreign currency bank accounts and forward foreign exchange contracts.
Pension Liability Risk
The Group has no association with any defined-benefit pension scheme and therefore carries no deferred, current or future liabilities in respect of such a scheme. The Group operates a number of Group Personal Pension Plans for colleagues.
Liquidity Risk
The Group ensures that it has sufficient cash or loan facilities to meet all its commitments when they fall due by ensuring that there is sufficient cash or working capital facilities to meet the cash requirements of the Group for the current Business Plan. The minimum liquidity level is currently set at £30m, such that under the Treasury Policy the maximum drawings would be £270m of the £300m available facility.
The process to manage the risk is to ensure there are contracts in place for key suppliers detailing the payment terms, and for providers of debt the Group ensured that such counterparties used for credit transactions held at least an 'A' credit rating at the time of refinancing (November 2010). Ancillary business, in the main, is directed to the five banks within the club banking group. At the year-end four of the banks within this group maintained a credit rating of 'A' or above. The counterparty credit risk is reviewed in the Treasury Report, which is forwarded to the Treasury Committee and the Group Treasurer reviews credit exposure on a daily basis.
The risk is measured through review of forecast liquidity each month by the Group Treasurer to determine whether there are sufficient credit facilities to meet forecast requirements, and through monitoring covenants on a regular basis to ensure there are no significant breaches, which would lead to an "Event of Default". Calculations are submitted bi-annually to the club bank agent. There have been no breaches of covenants during the reported periods.
Andrew Findlay
Finance Director
30 May 2012